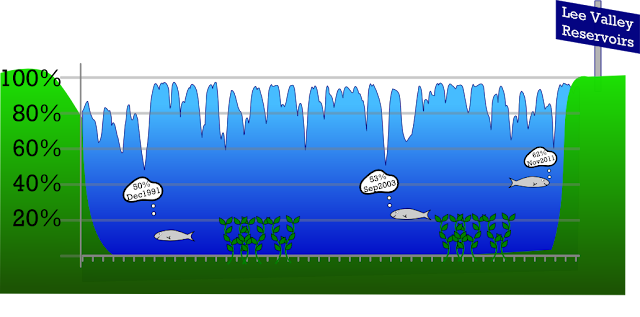
Reservoir levels - Lee Valley 1987-2012
Part of an on going attempt to improve the quality of my data visualisations on the blog, I'm attempting to come up with slightly more innovation or interesting ways of presenting data graphically. This chart shows the amount of water in the Lee Valley Reservoirs between 1987 and 2012.
Hopefully my graphic ability will increase with time and move on from these amateurish efforts! I decided to remove the time scale at the bottom and instead focus on identifying the spikes, as whilst it reduces the utility of the chart, it sets certain spikes in context.
What I find interesting is that even the lowest spike on record has only taken the Lee Valley reservoirs down to 50% capacity, though as recently as 2011 levels dropped to 62%, though given the amount of rain in 2012, they have remained at nearly full capacity over the past 12 months.
The chart was made by exporting an MS Excel graph into Inkscape, where I added a fill and some tasteful cartoon fish and weed.


Comments
Post a Comment
Please leave a comment to let me know if you think I've got it totally or partially wrong!