Modelling fire brigade responses
In my last post I explained some of the processing of the London Fire Brigade incident data. In this post I look at the actual data and begin to consider what the impact of the proposed closure of Bow Fire Station.
So as a quick recap from the last post, I have now calculated the
distance from each of the 23,000 incidents in Tower Hamlets to eight fire stations (see below) using two methods.
With this distance data, I have flagged each incident as to whether or not the
station nearest the incident was the first to respond. However, just because the nearest
station didn’t respond doesn’t mean that a response will necessarily be slower; for example another station may have responded because of particular quirks of geography, or
because of the designation of ‘grounds’ that each station serves.
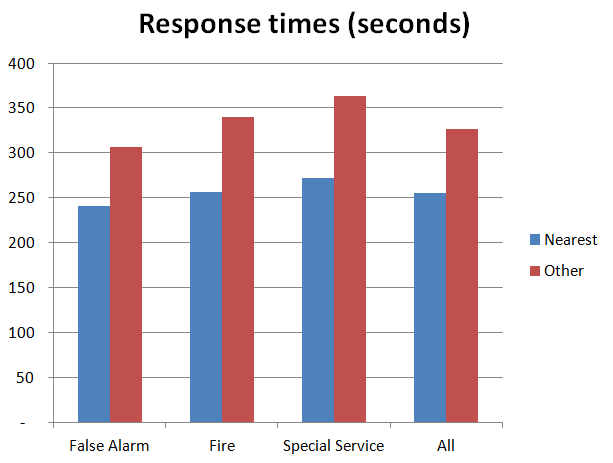
Excluding the data that doesn't include a record of which station responded, I can state that:
- In 64% of all incidents, the closest station responded first; which increases to 73% in the case of actual fires
- In incidents responded to by the nearest fire station, the response was on average 73 seconds quicker than for incidents not attended by the nearest fire station; this increases for instances of actual fire to 84 seconds.
|
False Alarm
|
Fire
|
Special Service
|
Grand Total
|
|
|
Number of incidents
responded to by:
|
||||
|
Nearest station
|
6,444
|
3,942
|
4,656
|
15,042
|
|
Other Station
|
2,793
|
1,103
|
1,161
|
5,057
|
|
Total
|
9,237
|
5,045
|
5,817
|
20,099
|
|
% of incidents
responded to by:
|
||||
|
Nearest station
|
66.36%
|
72.91%
|
56.23%
|
64.29%
|
|
Other station
|
33.64%
|
27.09%
|
43.77%
|
35.71%
|
|
Average time for
first engine to arrive (seconds):
|
||||
|
Nearest station
|
241
|
256
|
272
|
255
|
|
Other station
|
307
|
340
|
363
|
327
|
|
All
|
261
|
275
|
290
|
273
|
There are a small number of incidents which were responded
to by fire stations outside of Tower Hamlets. To simplify and to avoid any
potential skew in my analysis I’ll be applying some filters to the data.
The table below shows the number of incidents in Tower
Hamlets that each fire station was the first to respond to. The six Tower
Hamlets fire stations and ‘NULL’ (ie no station or response time was logged) make up the top 7. Millwall, which is ranked
at number 7, responded to twice as many incidents as Shoreditch the next
highest placed station, which in turn responded to 7 times as many incidents as
Homerton, which gives an indication of the drop-off in responses from stations outside of Tower Hamlets.
|
Responding station
|
Number of incidents responded to by
station
|
% of incidents responded to
|
|
Poplar
|
4,858
|
20.76%
|
|
Bethnal Green
|
4,445
|
19.00%
|
|
Whitechapel
|
3,315
|
14.17%
|
|
NULL
|
3,299
|
14.10%
|
|
Bow
|
2,668
|
11.40%
|
|
Shadwell
|
2,223
|
9.50%
|
|
Millwall
|
1,515
|
6.47%
|
|
Shoreditch
|
718
|
3.07%
|
|
Homerton
|
101
|
0.43%
|
|
Silvertown
|
66
|
0.28%
|
|
Kingsland
|
63
|
0.27%
|
|
Dowgate
|
49
|
0.21%
|
|
Dockhead
|
20
|
0.09%
|
|
Stratford
|
19
|
0.08%
|
|
Plaistow
|
18
|
0.08%
|
|
Greenwich
|
5
|
0.02%
|
|
Clerkenwell
|
3
|
0.01%
|
|
East Greenwich
|
3
|
0.01%
|
|
Islington
|
2
|
0.01%
|
|
Stoke Newington
|
1
|
0.00%
|
|
Woolwich
|
1
|
0.00%
|
|
Deptford
|
1
|
0.00%
|
|
Hainault
|
1
|
0.00%
|
|
Tottenham
|
1
|
0.00%
|
|
Old Kent Road
|
1
|
0.00%
|
|
Euston
|
1
|
0.00%
|
|
Paddington
|
1
|
0.00%
|
In tranche 1 of my analysis, I will filter on the 6 Tower
Hamlets stations, plus Shoreditch and Homerton which are near the border. In mapping the nearest station I will also include Stratford which is the next
nearest station to Bow.
Question 1: what
would happen if all incidents were responded to by the nearest fire station?
We know from the first table that 65% of incidents are
responded to by the nearest fire station. But what if every incident was? The
answer lies below:
On average, the responding fire station is 862 metres from
the incident, whereas, if all incidents were attended by the nearest station,
this would reduce to 721 metres, or a 16% fall.
|
Direct distance
|
||||
|
| ||||
|
Average distance between responding fire station and incident
|
865
|
882
|
841
|
862
|
|
Average distance between incident and nearest station
|
706
|
741
|
728
|
721
|
|
Reduction in average distance per incident
|
159
|
141
|
113
|
141
|
|
% Reduction in average distance per incident
|
18%
|
16%
|
13%
|
16%
|
A similar reduction is evident on my‘perpendicular’
measure of distance.
|
Perpendicular
distance
|
||||
|
False Alarm
|
Fire
|
Special Service
|
Grand Total
|
|
|
Average distance between responding fire station and incident
|
1,099
|
1,120
|
1,065
|
1,094
|
|
Average distance between incident and nearest station
|
892
|
942
|
919
|
912
|
|
Reduction in average distance per incident
|
207
|
178
|
146
|
182
|
|
% Reduction in average distance per incident
|
19%
|
16%
|
14%
|
17%
|
However, this is looking at all incidents. If we focus attention on those where the nearest station didn’t respond, we logically see a greater difference. Indeed, the data shows that if the nearest station responded, the distance reduces by 40% on both measures, reducing the average distance by 600m. What’s most interesting is that I have already excluded the incidents responded to by stations beyond the immediate boundaries of the borough.
|
Direct
distance: incidents where the nearest station didn’t respond
|
||||
|
False Alarm
|
Fire
|
Special Service
|
Grand Total
|
|
|
Average distance between responding fire station and incident
|
1,289
|
1,536
|
1,448
|
1,379
|
|
Average distance between incident and nearest station
|
743
|
863
|
855
|
795
|
|
Reduction in average distance per incident
|
546
|
673
|
593
|
584
|
|
% Reduction in average distance per incident
|
42%
|
44%
|
41%
|
42%
|
|
Perpendicular
distance: incidents where nearest station didn’t respond
|
||||
|
False Alarm
|
Fire
|
Special Service
|
Grand Total
|
|
|
Average distance between responding fire station and incident
|
1,648
|
1,917
|
1,817
|
1,745
|
|
Average distance between incident and nearest station
|
945
|
1,084
|
1,073
|
1,004
|
|
Reduction in average distance per incident
|
703
|
832
|
745
|
741
|
|
% Reduction in average distance per incident
|
43%
|
43%
|
41%
|
42%
|
Question 2: What
would be the impact of Bow Station closing?
So for this question, I looked at the incidents that Bow
Fire Station attended. Had Bow station closed pre-2009, fire appliances would have been required to travel 67% further on the direct basis and 56% on the perpendicular
basis. It is sensible to assume an increase in response time would be inevitable.
|
Direct
distance: impact of closure of Bow station
|
||||
|
False Alarm
|
Fire
|
Special Service
|
Grand Total
|
|
|
Average distance between Bow fire station and incident
|
982
|
883
|
873
|
915
|
|
Average distance between incident and nearest station other than
Bow
|
1,460
|
1,564
|
1,578
|
1,531
|
|
Increase in average distance per incident
|
478
|
681
|
705
|
616
|
|
% Increase in average distance per incident
|
49%
|
77%
|
81%
|
67%
|
|
Perpendicular
distance: impact of closure of Bow station
|
||||
|
False Alarm
|
Fire
|
Special Service
|
Grand Total
|
|
|
Average distance between Bow fire station and incident
|
1,283
|
1,138
|
1,125
|
1,186
|
|
Average distance between incident and nearest station other than
Bow
|
1,748
|
1,913
|
1,912
|
1,853
|
|
Increase in average distance per incident
|
465
|
776
|
787
|
667
|
|
% Increase in average distance per incident
|
36%
|
68%
|
70%
|
56%
|
However, in 80% of the incidents dealt with by Bow, Bow was
actually the closest station. Had Bow been closed the average distance to the
next nearest station would on average be a further 1km further away. For these incidents
we are broadly talking about more than doubling of distance.
|
Direct
distance: impact of closure of Bow station on incidents where Bow was the
closest station
|
||||
|
False Alarm
|
Fire
|
Special Service
|
Grand Total
|
|
|
Average distance between Bow fire station and incident
|
705
|
715
|
740
|
721
|
|
Average distance between incident and nearest station other than
Bow
|
1,723
|
1,708
|
1,708
|
1,713
|
|
Increase in average distance per incident
|
1,018
|
993
|
968
|
991
|
|
% Increase in average distance per incident
|
144%
|
139%
|
131%
|
137%
|
|
Perpendicular
distance: impact of closure of Bow station on incidents where Bow was the
closest station
|
||||
|
False Alarm
|
Fire
|
Special Service
|
Grand Total
|
|
|
Average distance between Bow fire station and incident
|
901
|
923
|
951
|
927
|
|
Average distance between incident and nearest station other than
Bow
|
2,045
|
2,081
|
2,062
|
2,062
|
|
Increase in average distance per incident
|
1,144
|
1,159
|
1,110
|
1,135
|
|
% Increase in average distance per incident
|
127%
|
126%
|
117%
|
122%
|
Question 3: How would
that affect the response time?
To understand the impact on response time, we need to know
the relationship between distance and speed. For each incident I calculated an
average speed to see if longer distances allowed faster average speeds to be
achieved. I plotted distance and speed on a scatter graph to see if visually
there was a relationship. There were some very odd results.
The speed of sound is about 340m per second. The vertical axis below shows speed in metres per second.

On further probing, there were 88 lines of data where
average speed was greater than 30 metres per second (67.5mph) and the maximum
speed I calculated was over 479m per second, or just over 1,000mph.
I initially
thought that this might be the result of the rounded location affecting very
short distances- in fact, this particular data point was for a journey of over a
kilometre. I don’t know if this is indicative of a systematic flaw in how
response times are recorded, or just a few erroneous outliers. I reran the above
analysis excluding these data points and the difference was immaterial (these are, after all, 88
points averaged over 23,000).
Eye-balling the data plotted in the scatter graph below indicates a positive correlation, though the nature of the correlation needs investigation.

So, there does appear to be some link between speed
and distance (greater distance allows faster speed) but the relationship is not
clear and would require a regression to establish what factors, such as time of day
affects the speed. If I find time I might investigate further.


Comments
Post a Comment
Please leave a comment to let me know if you think I've got it totally or partially wrong!