Crime in St Katharines and Wapping
An analysis of crime trends in the local area
Since I first tweeted about a violent attack in Wapping Woods back in mid-December, things have moved on apace, with a second knife attack taking place over the festive period and an arrest made (hopefully the right person - I have contacted the local SNT to see if the individual has been released or charged).
The increased focus on law and order in the Wapping Twittersphere made me consider how much crime there is in the local area. As I host this blog on blogger, I am limited in the coding I can host here and I as don't want to have to maintain a 'proper' website, I'm not able to use the API for crime statistics, if you want to look at crime maps etc visit this page or this page which allows you to go to a 'sub-ward' level.
However, I'm interested at looking at long term crime trends, which the aforementioned websites aren't suited to. I have obtained an annual crime dataset at ward level up to 31 March 2012 from this page (the specific file is here).
First I considered the total number of crimes recorded/reported in the Ward. The left hand scale (blue line) is the number of crimes, the red line/right hand scale is the crime rate expressed as crimes per 1,000 residents. [Note there was an error on my original graph in labelling, which I have now replaced]

As the population has remained broadly level, from this point I consider only the number of crimes, as I think it's a more useful statistic than a crime rate.
Looking at a breakdown of crimes by type, we can see that 'theft and handling' is the single largest component of crime figures, and has experienced a significant decline over the period.

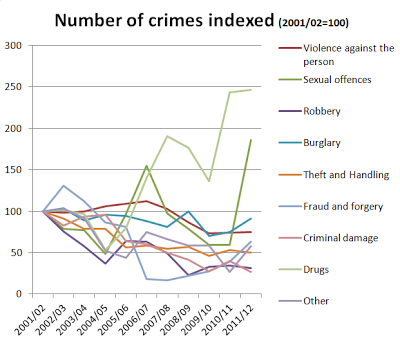
If we index the data, we are better able to see the relative change in the number of each type of crime. Indexing means that for each type of crime a base figure (in this case 2001/02) is set to equal 100, so that relative trends are more evident. What this shos is that for all types of crime, there has been a fall over the period 2001/11 with the exception of drugs and sexual offences, which have experienced an increase. However, in 2001/02 there were 'only' 10 sexual offences and in 2011/12 there were 19, so whilst there is a large relative increase, the absolute increase is relatively small and makes up a small proportion of crimes. With respect of drugs, the increase may be as a result of increase police focus, leading to more arrests rather than any underlying changes in the level of criminality.
So in conclusion, overall crime rates in the area have fallen, driven largely by a reduction in reports of theft.
One word of caution, these are recorded crimes, the actual crime rate may be higher because of people not reporting crime. I will have a look at the British Crime Survey (which surveys individuals) to see if there is an underlying trends in reporting that may affect the validity of the analysis above.
My next step is to finish manually combining monthly crime files for the area, before attempting to also try to manipulate the slightly unfriendly formats that the police provide data in to make it broadly geographic but sufficiently anonymous, which makes my life slightly harder.
Since I first tweeted about a violent attack in Wapping Woods back in mid-December, things have moved on apace, with a second knife attack taking place over the festive period and an arrest made (hopefully the right person - I have contacted the local SNT to see if the individual has been released or charged).
The increased focus on law and order in the Wapping Twittersphere made me consider how much crime there is in the local area. As I host this blog on blogger, I am limited in the coding I can host here and I as don't want to have to maintain a 'proper' website, I'm not able to use the API for crime statistics, if you want to look at crime maps etc visit this page or this page which allows you to go to a 'sub-ward' level.
However, I'm interested at looking at long term crime trends, which the aforementioned websites aren't suited to. I have obtained an annual crime dataset at ward level up to 31 March 2012 from this page (the specific file is here).
First I considered the total number of crimes recorded/reported in the Ward. The left hand scale (blue line) is the number of crimes, the red line/right hand scale is the crime rate expressed as crimes per 1,000 residents. [Note there was an error on my original graph in labelling, which I have now replaced]
Both the number of crimes and the crime rate follow almost exactly the same trend, with nearly a halving of total crime between 2001/02 and 2009/10 before a slight increase in the final two years. However, the 2009/10 figures look like a blip with the 2010/11 & 2011/12 figures more consistent with the trend from 2004/05.

As the population has remained broadly level, from this point I consider only the number of crimes, as I think it's a more useful statistic than a crime rate.
Looking at a breakdown of crimes by type, we can see that 'theft and handling' is the single largest component of crime figures, and has experienced a significant decline over the period.

If we index the data, we are better able to see the relative change in the number of each type of crime. Indexing means that for each type of crime a base figure (in this case 2001/02) is set to equal 100, so that relative trends are more evident. What this shos is that for all types of crime, there has been a fall over the period 2001/11 with the exception of drugs and sexual offences, which have experienced an increase. However, in 2001/02 there were 'only' 10 sexual offences and in 2011/12 there were 19, so whilst there is a large relative increase, the absolute increase is relatively small and makes up a small proportion of crimes. With respect of drugs, the increase may be as a result of increase police focus, leading to more arrests rather than any underlying changes in the level of criminality.

Showing the data at each end of the period, allows us to see easily where the big changes are (but there may have been variation in the middle years).
2001/02
|
2011/12
|
Change
| |
Violence against the person
|
209
|
159
|
-24%
|
Sexual offences
|
10
|
19
|
90%
|
Robbery
|
57
|
18
|
-68%
|
Burglary
|
179
|
166
|
-7%
|
Theft and Handling
|
1,065
|
540
|
-49%
|
Fraud and forgery
|
229
|
147
|
-36%
|
Criminal damage
|
231
|
62
|
-73%
|
Drugs
|
29
|
73
|
152%
|
Other
|
22
|
13
|
-41%
|
Total
|
2,031
|
1,197
|
-41%
|
One word of caution, these are recorded crimes, the actual crime rate may be higher because of people not reporting crime. I will have a look at the British Crime Survey (which surveys individuals) to see if there is an underlying trends in reporting that may affect the validity of the analysis above.
My next step is to finish manually combining monthly crime files for the area, before attempting to also try to manipulate the slightly unfriendly formats that the police provide data in to make it broadly geographic but sufficiently anonymous, which makes my life slightly harder.


Comments
Post a Comment
Please leave a comment to let me know if you think I've got it totally or partially wrong!